
The 2024 ICW Chartbook is now available from Amazom.com which includes 385 charts from 29 NOAA chartkits covering:
• Norfolk, VA to Key West, FL
• St Lucie to Ft Myers and part way down the coast
• 17 major inlets along the ICW
Link at: 2024 Atlantic ICW Chartbook
Note: Amazon does not proivde a spiral bound copy. The photo is of a chartbook taken to a local binder where he converted it to spiral bound for $5.
Why publish a chartbook in paperchart format (RNC) when you can see the digital version in Aqua Map, Navionics, or your chartplotter? Well, in all fairness, the raster version provides some detail such as bridge heights and feature names with an overall view of a channel that can be useful in finding your way down the ICW. Since each page covers 5 miles, it's easy to flip a few pages in planning mode to see where you would be 40 or 50 miles down the ICW.
Each page of the chartbook covers a five mile segment of the ICW which results in 385 pages of charts. Every mile of the ICW from Norfolk to Key West and across from St Lucie to Ft Myers is covered with no gaps. Many inset charts are also included for added detail in busy areas along with 17 inlets along the ICW. With a chart zoomed in to cover every 5 miles, the features (bridge names, clearances, buoy labels, etc.) are generally larger and easier to read than the NOAA charts scaled for Carriage Requirements (see the last photo for more explanation on this point).

The Table of Contents is in mile marker order with page numbers for quick access to the chart you want. An index is provided at the end for accessing the same information but in alphabetical order using familiar place names, again with page numbers.
Detail contents in 385 color charts:
• Northern Approach to Norfolk VA
• Norfolk VA to Albemarle Sound
• Dismal Swamp to Albemarle Sound
• Albemarle Sound to Key West, FL
• St Lucie, FL to Ft Myers, FL (both the shore route and across Lake Okeechobee are included)
• Ft Myers, FL to Matanzas Pass, FL
• Matanzas Pass, FL to Key West, FL (not in 5 mile steps)
• 17 Inlets along the ICW
• List of NOAA chart notes
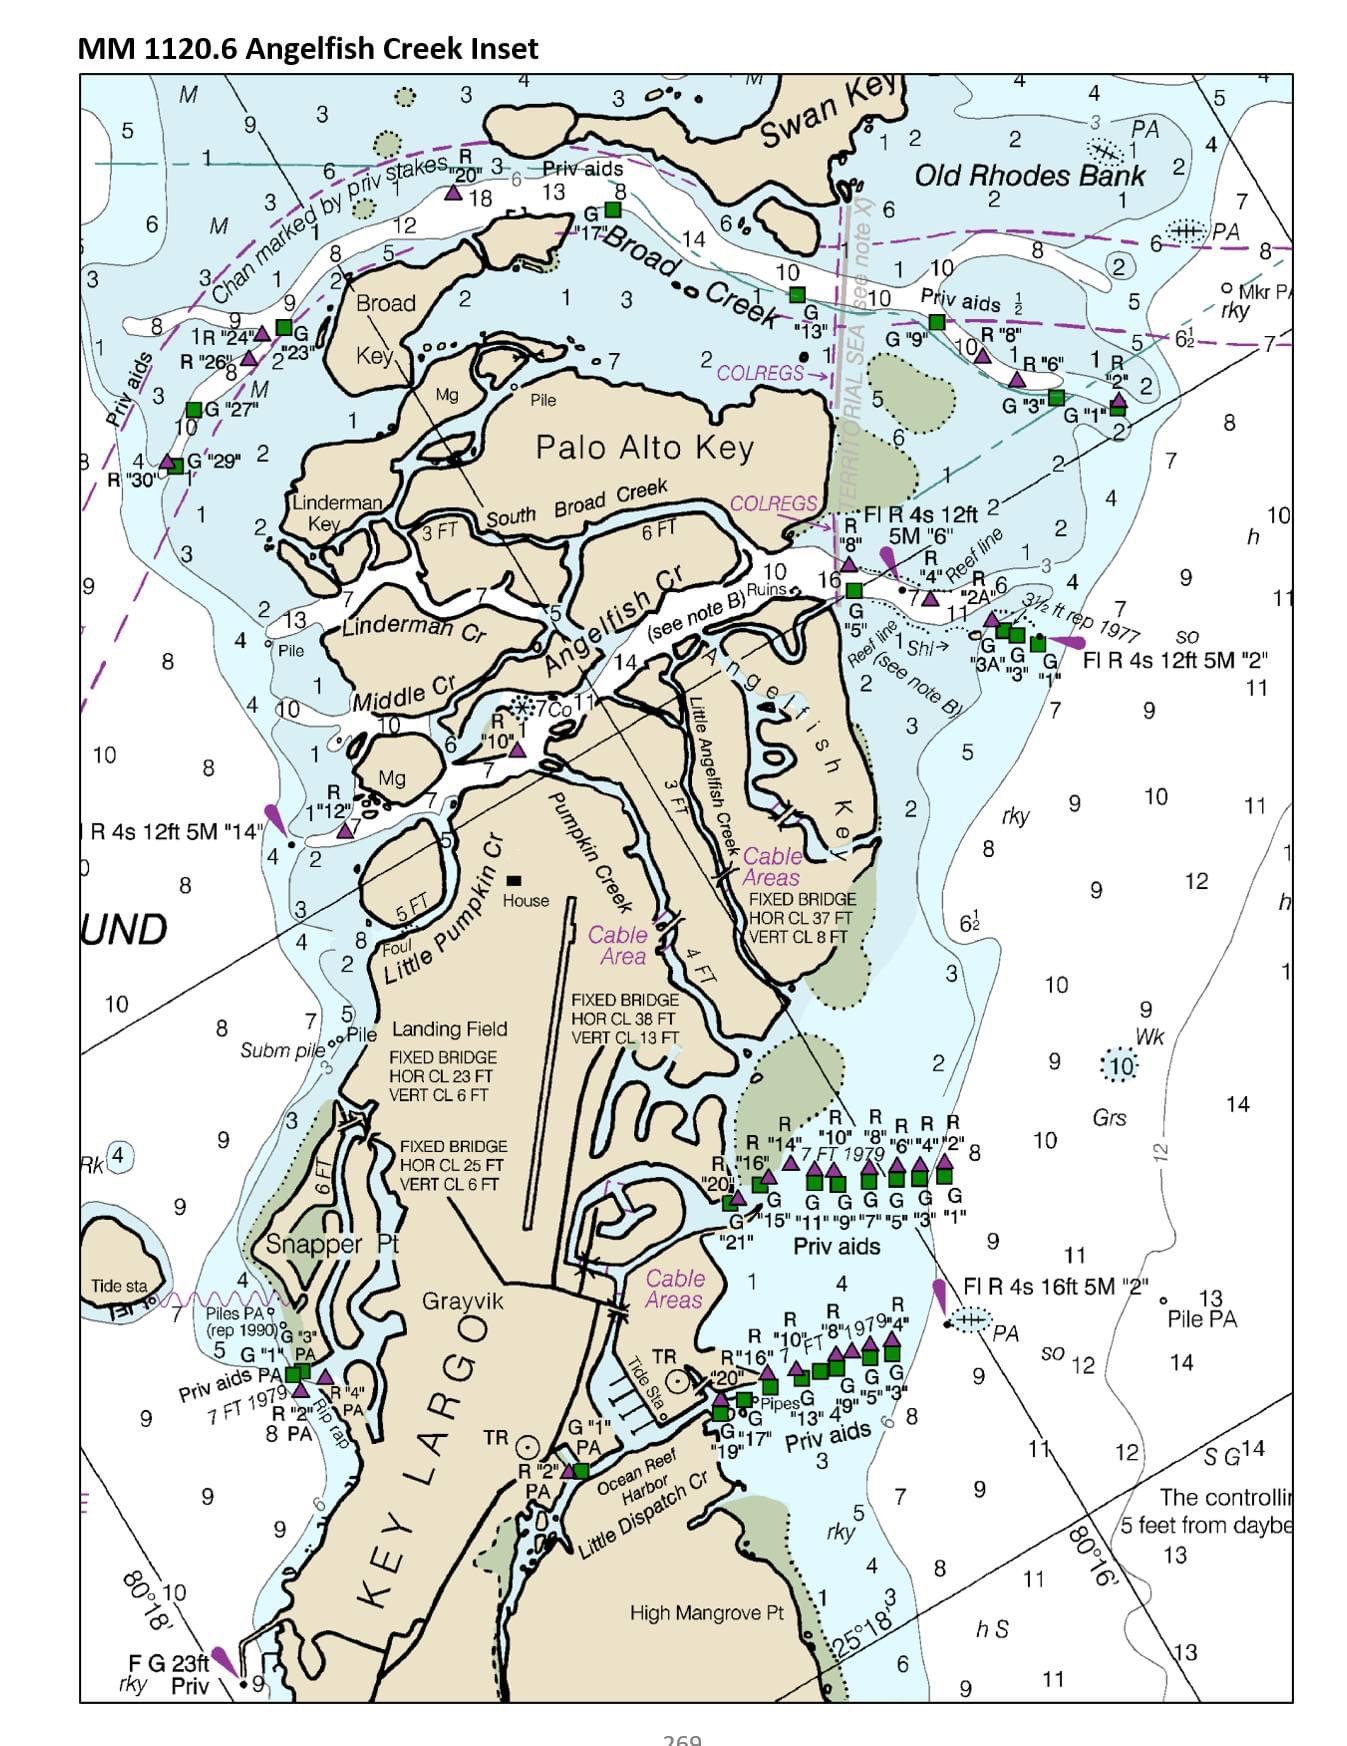
The attached photos are pages out of the Chartbook to illustrate editing with insets used to maximize the readability of the charts.
Note: the charts are shown at a reduced resolution in the overview for quick loading which may appear blurry in some sample pages. To view a sample chart at the full resolution used in the Chartbook, just tap or click on any chart for the photo view.
This list of NOAA charts was used in the compiling of the chartbook, including:
- Chart Title
- Chart Number
- Last Correction (to the chart)
- Cleared thru LNM No. (updated through the date shown)
- Cleared thru NM No. (updated through the date shown)

Example of a 5 mile section of the chartbook showing the northern entrance to the Alligator River in North Carolina

The chart below is an example of a detail chart of an important area that’s added to the chart group. In this case, it’s the approach shown in the chart above but in a zoomed in view for easier interpretation.

Here’s another example of a detailed chart included within the 5 mile charts. It’s an area just north of Beaufort, NC, that is often confusing to boaters due to multiple channels and ATONs. The detailed chart makes the ICW route clearer.

When space permits, an inset chart is included in the 5 mile chart to better show a critical section of the 5 mile chart. In this case, a detail inset chart is shown of Hell Gate just south of Savannah, Georgia.


No comments:
Post a Comment